Elliott Wave Theory
Elliott explained that the upward and downward swings of
the mass psychology always showed up in the same repetitive
patterns, which were then divided into patterns he called
"waves". He needed to claim this observation and so he came up
with a super original name: The Elliott Wave Theory.
The 5 – 3 Wave Patterns
Mr. Elliott showed that a trending market moves in what he
calls a 5-3 wave pattern. The first 5-wave pattern is called
impulse waves and the last 3-wave pattern is
called corrective waves.
Let’s first take a look at the 5-wave impulse pattern. It’s
easier if you see it as a picture:
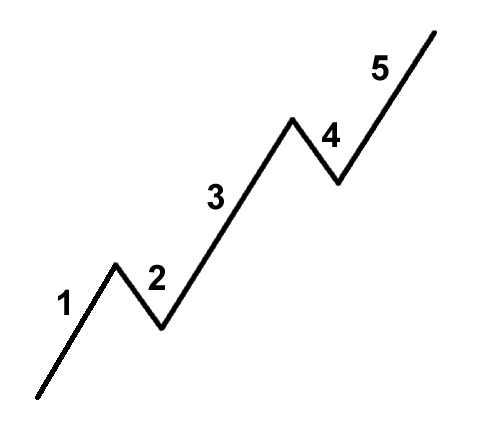
That still looks kind of confusing. Let’s splash some
color on this bad boy.
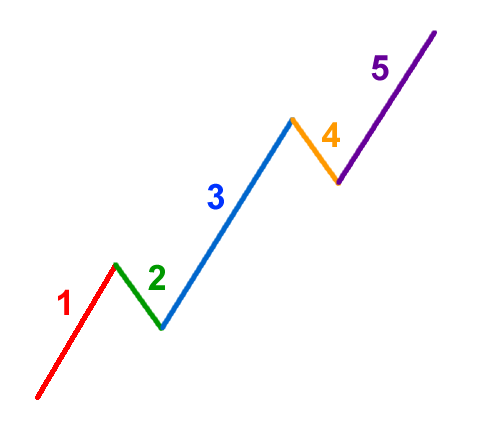
Here is a short description of what happens during each
wave. I am going to use stocks for my example since stocks is
what Mr. Elliott used but it really doesn’t matter what it is.
It can easily be currencies, bonds, gold, oil, or Tickle Me
Elmo dolls. The important thing is the Elliott Wave Theory can
also be applied to the foreign exchange market.
Wave 1
The stock makes its initial
move upwards. This is usually caused by a relatively small
number of people that all of the sudden (for a variety of
reasons real or imagined) feel that the price of the stock
is cheap so it’s a perfect time to buy. This causes the
price to rise.
Wave 2
At this point enough people
who were in the original wave consider the stock overvalued
and take profits. This causes the stock to go down. However,
the stock will not make it to its previous lows before the
stock is considered a bargain again.
Wave 3
This is usually the longest
and strongest wave. The stock has caught the attention of
the mass public. More people find out about the stock and
want to buy it. This causes the stock’s price to go
higher and higher. This wave usually exceeds the high
created at the end of wave 1.
Wave 4
People take profits because
the stock is considered expensive again. This wave tends to
be weak because there are usually more people that are still
bullish on the stock and are waiting to “buy on the dips”.
Wave 5
This is the point that most
people get on the stock, and is most driven by hysteria. You
usually start seeing the CEO of the company on the front
page of major magazines as the Person of the Year. People
start coming up with ridiculous reasons to buy the stock and
try to choke you when you disagree with them. This is when
the stock becomes the most overpriced. Contrarians start
shorting the stock which starts the ABC pattern.
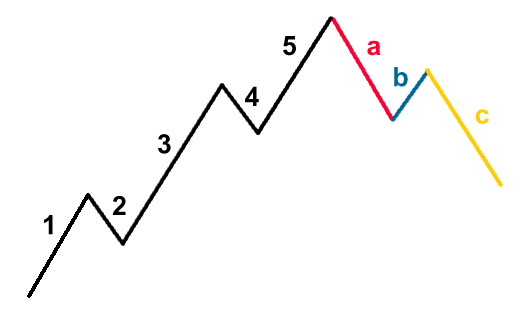
ABC Correction
The 5-wave trends are then corrected and reversed by 3-wave
countertrends. Letters are used instead of numbers to track
the correction. Check out this example of smokin’ hot 3-wave
corrective wave pattern!
For example, if you were to see “12,26,9” as the MACD
parameters (which is usually the default setting for most
charting packages), this is how you would interpret it:
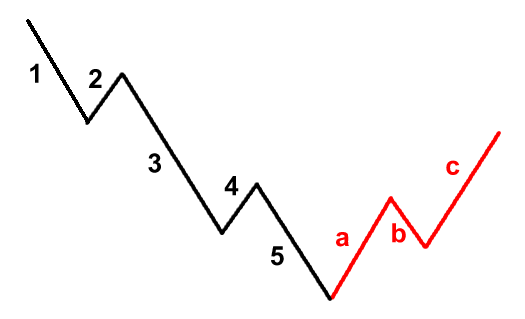
Just because I’ve been using a bull market as my primary example doesn’t mean the Elliot
Wave Theory doesn’t work on bear markets. The same
5 – 3 wave pattern can look like this:
Waves within a Wave
The other important thing you have to know about the Elliot
Wave Theory is that a wave is made of sub-waves? Huh? Let me
show you another picture. Pictures are great aren't they?
Yee-haw!
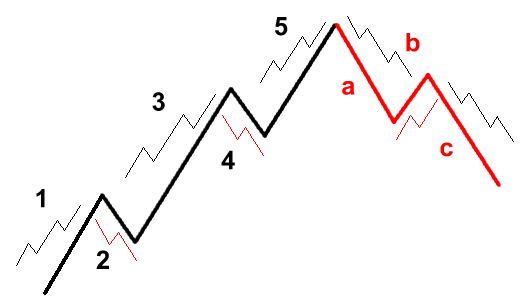
Do you see how Wave 1 is made up of a smaller 5-wave
impulse pattern and Wave 2 is made up of smaller 3-wave
corrective pattern? Each wave is always comprised of smaller
wave patterns.
Okay, let’s look at a real example.

As you can see, waves aren’t shaped perfectly in real life.
You’ll also learn its sometimes difficult to label waves. But
the more you stare at charts the better you’ll get.
Okay, that’s all you need to know about the Elliott Wave
Theory. Remember the market moves in waves. Now when you hear
somebody say “Wave 2 is complete.” You’ll know what the heck
he is talking about.
If you wish to become an Elliott Wave Theory guru, you can
learn more about it at www.elliottwave.com.
|